Beer Tap Flow Meters and Keg Tracking for Draught Control
 General
Draught beer is the least controlled product behind most Indian bars. A beer tracking meter that retrofits to existing taps measures every millilitre that passes, and a load cell keg tracker tells you what is left in the cellar. Between them they close the gap between what you bought and what you sold. This guide covers where shrinkage actually comes from, what the hardware costs, how the two technologies differ, and how to build a payback case that survives scrutiny.
Key Takeaways
- Draught shrinkage is normal, but anything beyond about five percent is a control problem rather than a physics problem.
- Flow meters measure what left the tap. Load cell keg trackers measure what is left in the keg. You want both numbers.
- Retrofit meters that clamp to existing taps avoid rebuilding the whole bar equipment install.
- Payback is driven by recovered volume, not by catching a specific person, so frame the project that way internally.
Where draught shrinkage actually comes from
Every draught beer system loses volume, and most of that loss is legitimate. Line cleaning purges beer. The first pour after a keg change is foam. Warm lines produce foam until the system settles. A bar that never wastes a drop is a bar that is not cleaning its lines properly.
Over pouring is the next layer. A bartender who fills past the line, tops up a short pour, or pours a taster is not stealing, but the volume leaves the keg and no revenue arrives. Across a busy Friday that adds up to several litres, and none of it appears in any report the manager reads on Monday.
Comped and staff drinks are the third layer, and the honest one. Most bars have a policy and almost none have a measurement. Without a meter, the difference between an authorised comp and an unauthorised one is invisible, which puts otherwise trustworthy staff in an unnecessarily grey position.
Then there is temperature and pressure. A keg run at the wrong carbon dioxide pressure produces foam on every pour, and a cellar running warm does the same. This is a technical fault that reads exactly like theft in the numbers, which is why measuring before accusing matters so much.
Finally there is genuine loss. Kegs that blow unnoticed, taps left dripping overnight and couplers that leak slowly all cost real money and none of them announce themselves. A cellar with no monitoring can lose a meaningful share of a keg to a drip that nobody noticed for three days.
Sorting these layers apart is the entire value of measurement. A bar that knows its line cleaning loss, its foam loss and its pour variance can act on the specific problem. A bar that only knows its total variance can only guess, and guessing usually lands on the wrong explanation.
Flow meters against keg load cells
A beer tap flow meter sits inline and counts volume as it passes. It tells you exactly what was dispensed from each tap, when, and in what pour sizes. Because it measures at the point of sale it can be reconciled directly against till data, which is where the useful insight comes from.
A load cell keg tracker sits under the keg and weighs it continuously. It tells you how much product remains, predicts when the keg will blow, and flags a keg losing weight when the bar is closed. That last capability catches leaks and after hours pours that a flow meter alone would attribute elsewhere.
The two answer different questions. The flow meter answers what did we serve. The load cell answers what do we have. Operators who buy only one usually discover the gap within a month, because reconciliation needs both sides of the equation to be measured rather than one side measured and the other estimated.
For a brewery supplying kegs to outlets, the load cell case is stronger still. Knowing remaining volume across a distributed estate turns delivery scheduling from guesswork into a route plan, and it settles disputes about how much product actually reached a venue without anyone having to argue from memory.
For a single venue, the flow meter usually comes first. It is cheaper, it retrofits to existing taps without cellar work, and the reconciliation against till data produces an actionable number in the first week. Load cells then follow once the venue wants to close the remaining gap.
Both integrate best when the data lands somewhere useful. Feeding pour data into the AI Command POS platform means variance appears next to sales rather than in a separate report that nobody opens, which is usually the difference between a system that changes behaviour and one that gathers dust.
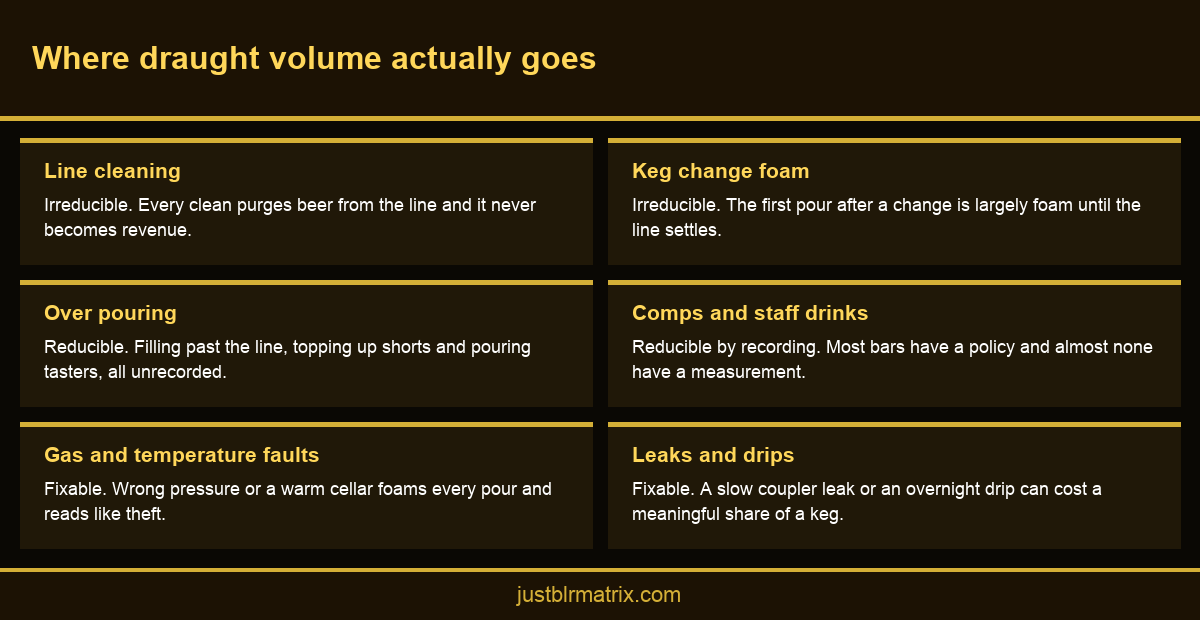 Infographic showing the six places draught beer volume is lost in a bar
What it costs and how to model the return
Pricing scales with tap count for meters and with keg position count for load cells. A small venue with four taps and four keg positions is a modest project. A multi floor venue with twenty taps and a large cellar is a different order of investment, and the per tap cost usually falls as the count rises.
The payback model starts with your current variance. Take purchased volume over a period, subtract sold volume from till data, and express the difference as a percentage. Most uncontrolled Indian bars land somewhere between eight and fifteen percent, against an achievable target of four to six once measurement is in place.
Apply the recoverable difference to your annual draught purchase value and you have the gross return. If a venue buys thirty lakh rupees of draught a year and recovers six percentage points of variance, the annual recovery comfortably exceeds the hardware cost for a typical tap count.
Be conservative and assume you will not recover all of it. Line cleaning loss is irreducible, foam on a keg change is irreducible, and some over pouring will persist. A model that claims to eliminate variance entirely will not be believed and does not need to be, because a partial recovery is already compelling.
Include the operational benefits that do not appear as recovered litres. Predicting a keg change before it happens avoids a dry tap during service. Knowing consumption by tap improves ordering. Both reduce the stockouts that quietly cost more than the shrinkage everyone is focused on.
Finally, cost the installation honestly. Retrofit meters on existing taps are quick. Load cells need cellar access and cable runs or reliable wireless. Ask for the installation quote separately from the hardware quote, because a low hardware price with an expensive install is not a saving.
Implementing it without alienating the bar team
Announce it as a stock control project, not as a theft investigation. Teams that believe they are being watched for dishonesty become defensive and disengaged. Teams that understand the venue is measuring foam, cleaning loss and pour consistency will generally help you find the problems, because most of them are not people problems.
Baseline before you change anything. Run the meters for two weeks with no policy changes and no conversations. That baseline is what makes every subsequent improvement measurable, and skipping it is the most common implementation mistake because everyone is impatient to act on the first surprising number.
Fix the technical causes first. Check cellar temperature, carbon dioxide pressure, line length and coupler condition. A meaningful share of what looks like over pouring is foam from a system fault, and fixing that first both improves the numbers and demonstrates good faith to the team.
Then set a pour standard and train to it. A measured pour is a skill, and most bartenders have never been given a target or any feedback. Publishing tap level variance weekly, without naming individuals, usually closes most of the remaining gap within a month through nothing more than awareness.
Formalise comps and staff drinks in the same pass. Give the team a legitimate route to pour a taster or replace a bad pint, recorded properly. Removing the grey area is what makes the remaining variance meaningful, because everything legitimate now has a record attached to it.
Review it alongside the rest of your bar programme rather than in isolation. Pour control, glass chilling, ice and service speed all interact, and the bar technology guide sets out how the stations fit together so that a fix in one place does not create a bottleneck in another.
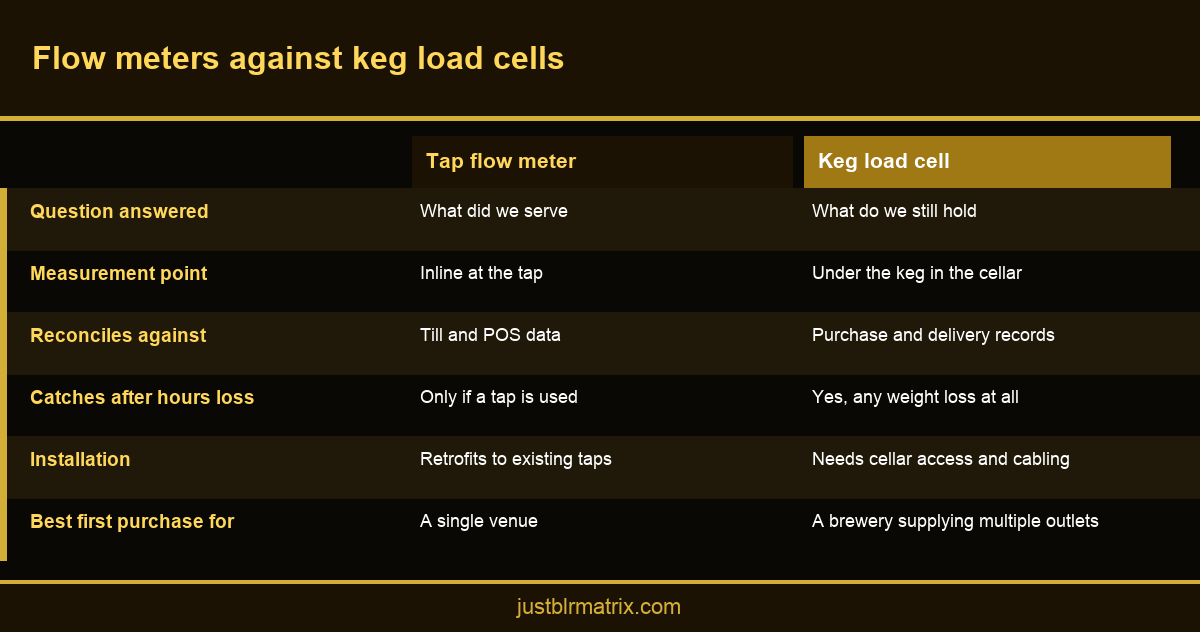 Comparison infographic of beer tap flow meters against keg load cell trackers
Conclusion
Beer tap flow meter and keg tracker pricing only makes sense against your own variance, so measure that first. Flow meters tell you what you served, load cells tell you what you hold, and you need both numbers to reconcile properly. Fix the technical causes before you address behaviour, baseline before you change anything, and frame the whole project as stock control. Get a quote sized to your tap and keg count.
Frequently Asked Questions
What does a beer tap flow meter do?

How is a keg load cell tracker different?
What is a normal level of draught shrinkage?
Can flow meters retrofit to existing taps?
How do I calculate the payback?
Will monitoring upset my bar team?
Why does carbon dioxide pressure affect the numbers?
Should a brewery track kegs at customer venues?
What else should be monitored alongside the taps?